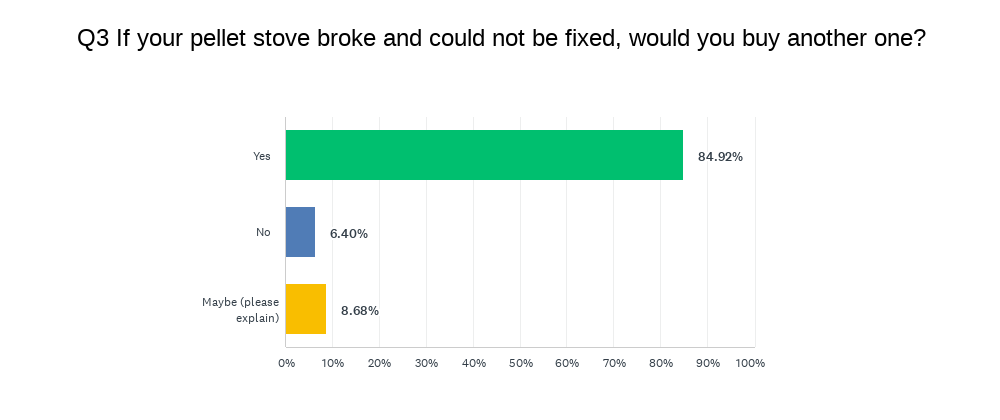
Q3. Would you buy another? This may be one of the most surprising results: 85% said they would buy another pellet stove if their current one could not be fixed, with another 9% choosing “Maybe.” This indicates a strong loyalty to the appliance. For those who selected “Maybe (please explain),” their answers were concerned with whether the price of pellets remained reasonable and if their health still allowed them to deal with the physicality of pellets. Another popular reason for explaining further was that they were confident they could fix their pellet stove if it ever stopped working: “I’d probably just fix it because they’re easy to repair.”
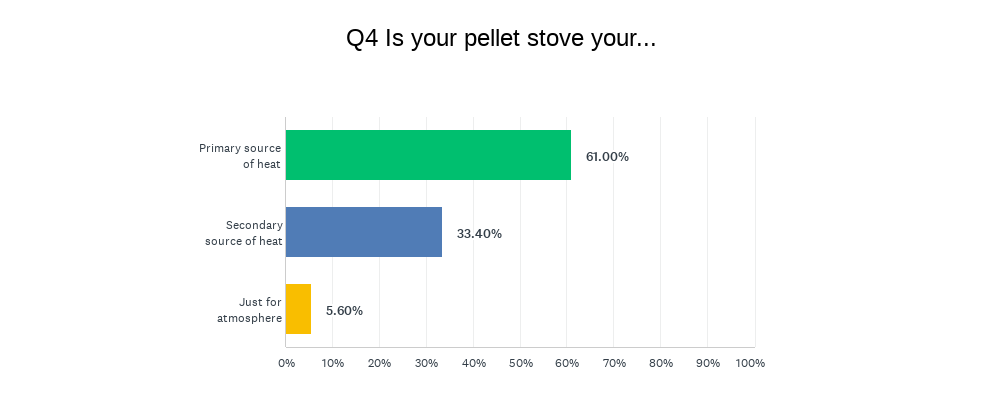
Q4. Primary or Secondary Heat? That 61%so many respondents use their pellet stove as a primary heater is somewhat surprising, since nationally, the number of people who use wood or pellet as a secondary heat source is higher than primary heat source. This may be because we tapped into a more enthusiastic demographic, or it may be an indication that pellet stove users use their stove for primary heating more than wood stove users. We also didn’t ask about house size, though we did ask about the number of people in the household, which averaged only 2.58. Thus, it may be that people who completed this survey have smaller homes, possibly close to the national median of 2,299 square feet for a single family home.
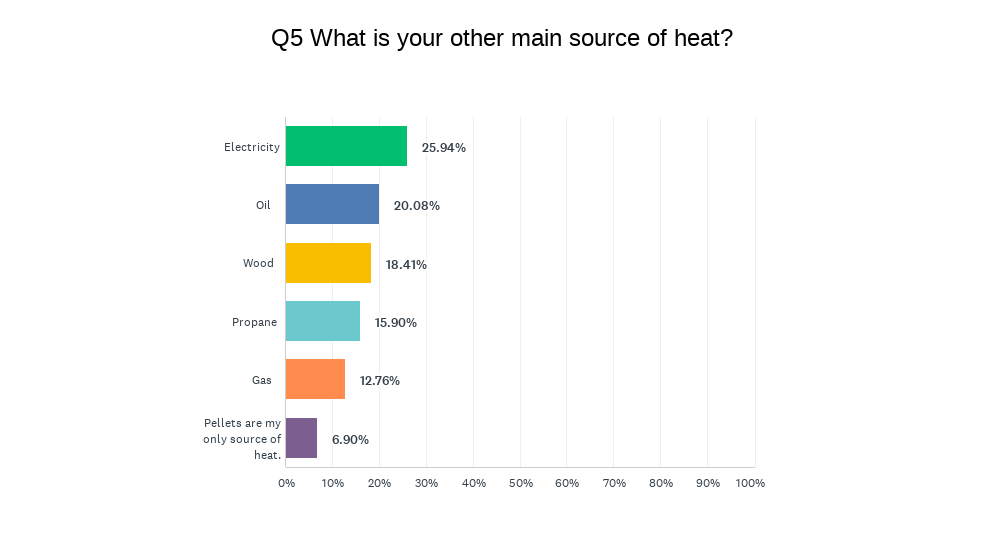
Q5. Other Main Source of Heat? Nothing surprising here. Electricity is the highest percentage with 26%, and many of those are likely homes with electric resistance heat or early model heat pumps which are not nearly as efficient as modern ones. It may come as a bit of a surprise to some that 18% of pellet stove users have cord wood as their other main source of heat. Cord wood is the third most common “other main source of heat” after electricity and oil, another indication that we may have reached a more hardcore, dedicated biomass heat demographic.
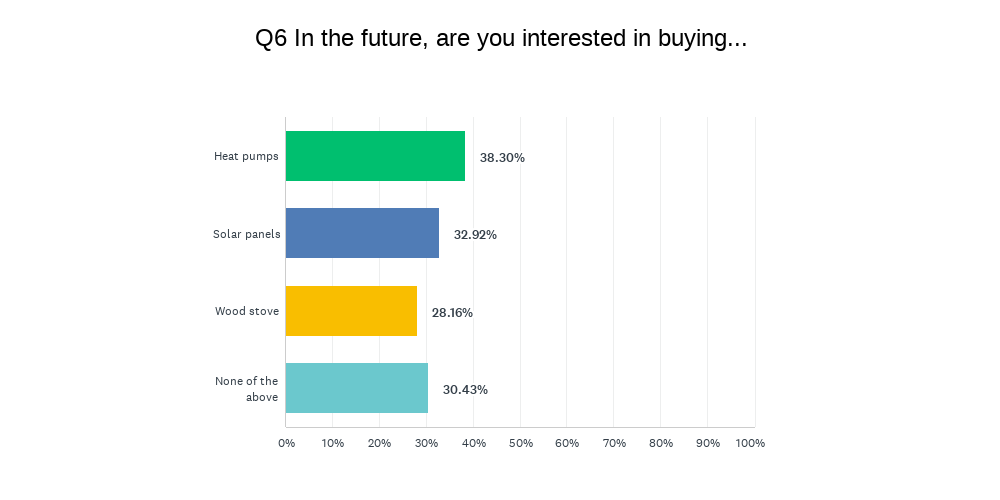
Q6. Interest in Heat Pumps or Solar Panels. Respondents could choose multiple answers on this one. On average, a respondent chose 1.3 options. We found it somewhat surprising to see such high interest in heat pumps and solar panels.
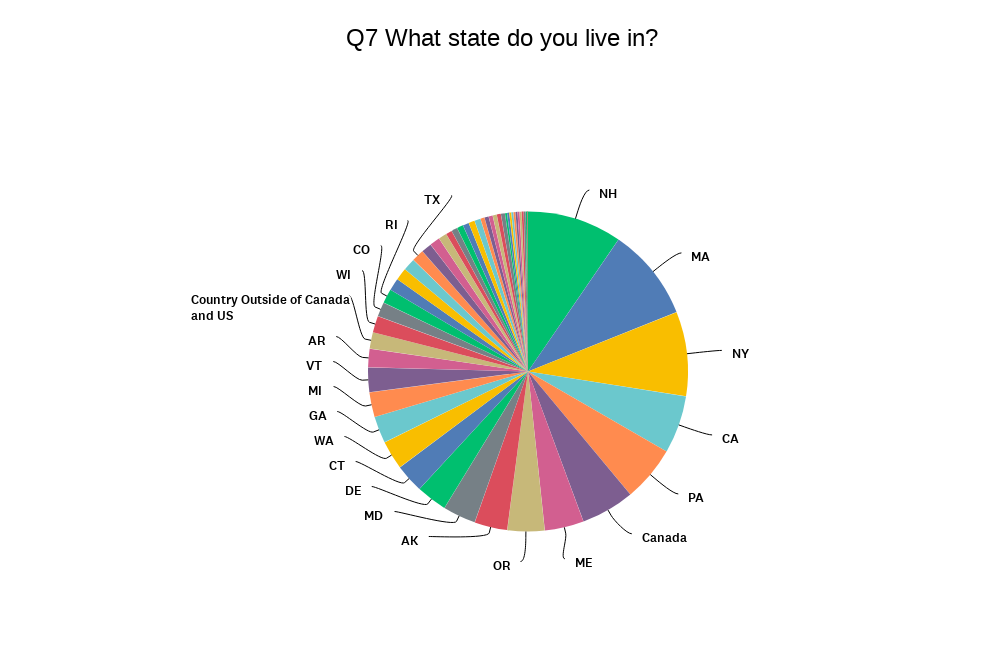
Q7.State of residence. No surprises here. The fact that we had such a good demographic diversity shows that our data doesn’t just represent one part of the country.
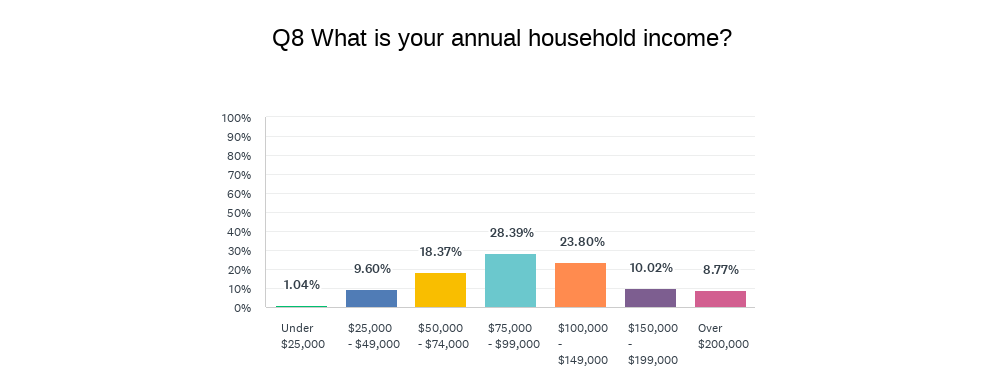
Q8. Household income. According to the US Census, the median household income was $74,580 and the average was $74,755 in 2022. Both fall right below the median income bracket of the respondents of our survey ($75,000 - $99,000). This shows a lower household income for this group compared to homes that have solar panels, or drive electric cars.
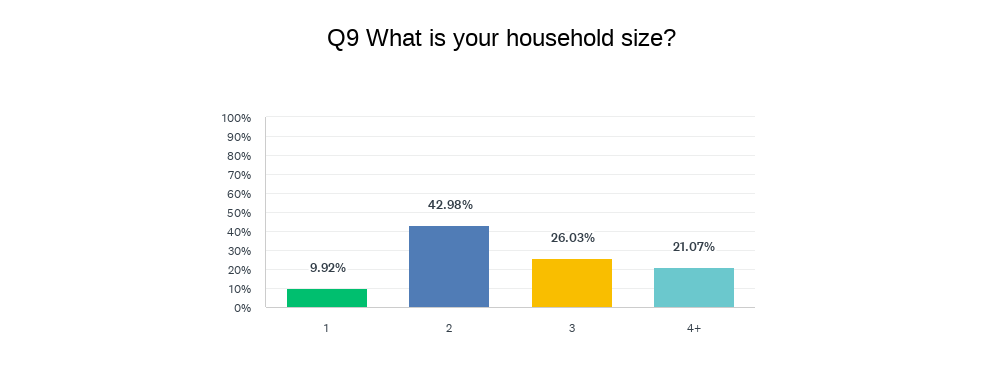
Q9.Household size. The average household size is 2.58, slightly larger than the national average of 2.51.
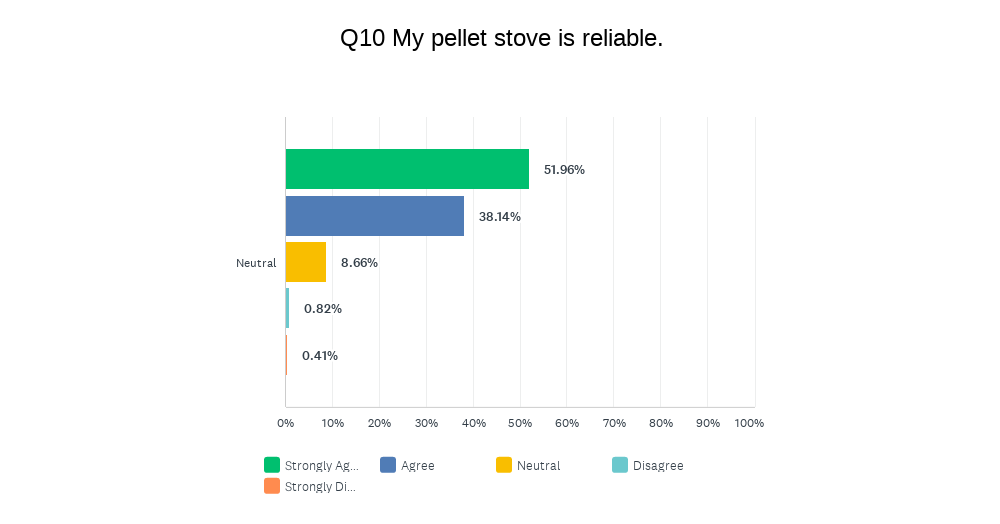
Q10. Is your stove reliable? The number of households who strongly agreed or agreed that their pellet stove is reliable is remarkably high (90.1%).
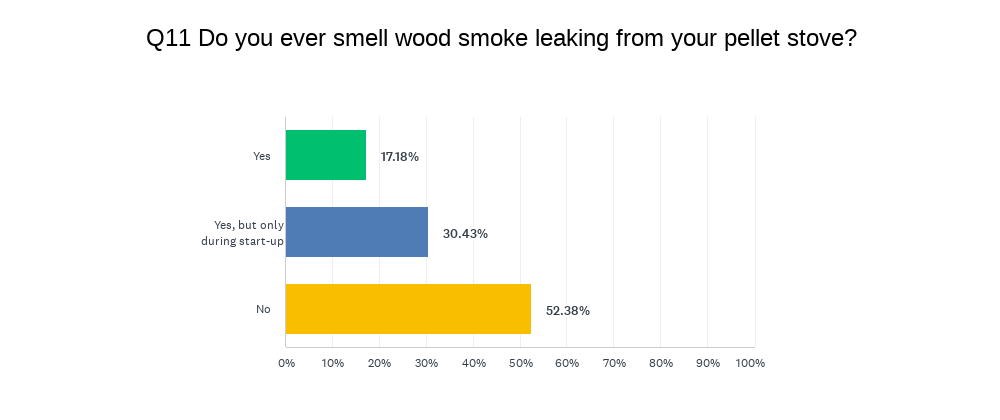
Q11. Do you smell wood smoke? While a majority did not smell any smoke in their house, 30% smelled some on start-up. And the fact that 17% of this group say they smell it more regularly is significant enough to warrant further study into this problem. AGH has done some at-home testing and found start-up smoke to produce about the same amount of PM as making breakfasts or dinners that involve frying, using a griddle or making well-done toast. While this was not an in-depth study, AGH believes that the very small amount of smoke during start up could be partially caused by stoves not being sufficiently cleaned, or it may be a design flaw in some stoves that are not completely airtight and can leak.
Q12. Concern about health impacts of wood smoke. This question was not worked as well as it could have been, because it could be interpreted two ways: first, are you concerned about the health effects of wood smoke generally, or are you concerned about the health effect of wood smoke from your own pellet stove. Thus, someone could be extremely concerned about the health implications but answered that they weren’t concerned because they didn’t smell it in their own home.

All of these tables can also be viewed on the Survey Monkey platform.
Overlaying Responses from Two Different Questions
Survey Monkey allows you to take the individual answers of a question and see how those people answered another question, because all answers are attached to an IP address. Thus, we were able to see how different demographics answered different questions.
Income and main reason to heat with pellets
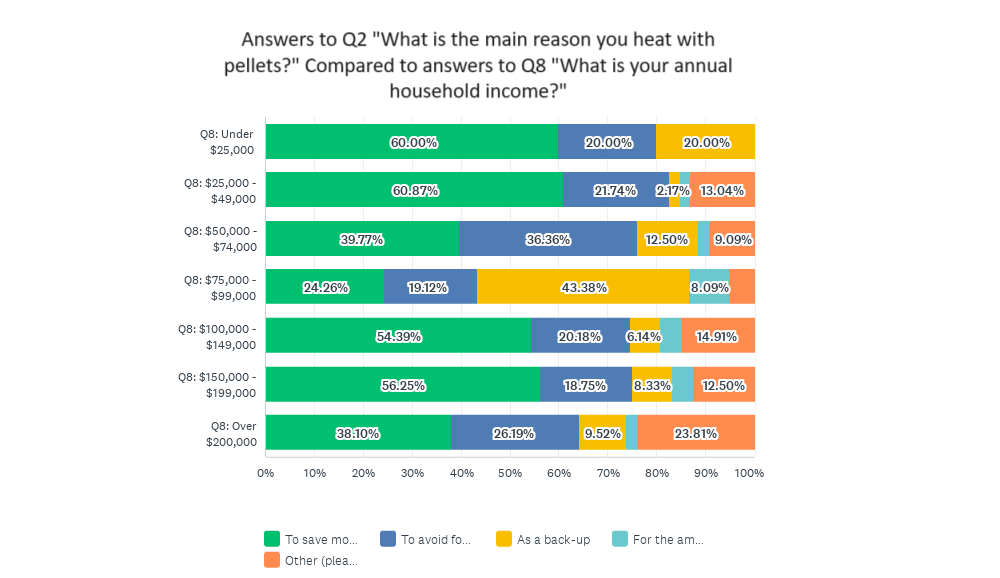
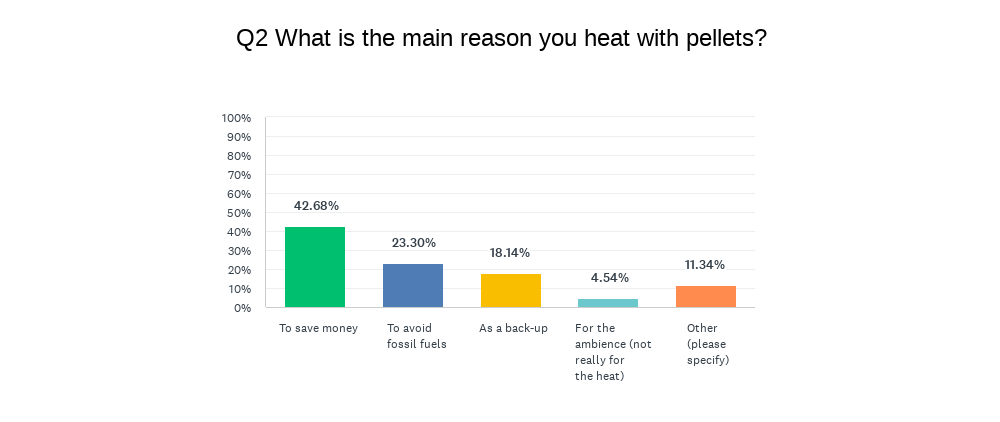
On Q2 overlaid with Q8, reasons for heating with pellets vs. income, saving money was the top rationale for all income categories exempt the middle, median income bracket. Lower income brackets favored saving money to some extent, and no one in the lowest bracket used their stove for ambience. As for being motivated to reduce fossil fuels, there is no clear pattern based on this sample of 486 people.
Main reason to heat with pellets and interest in buying other appliances
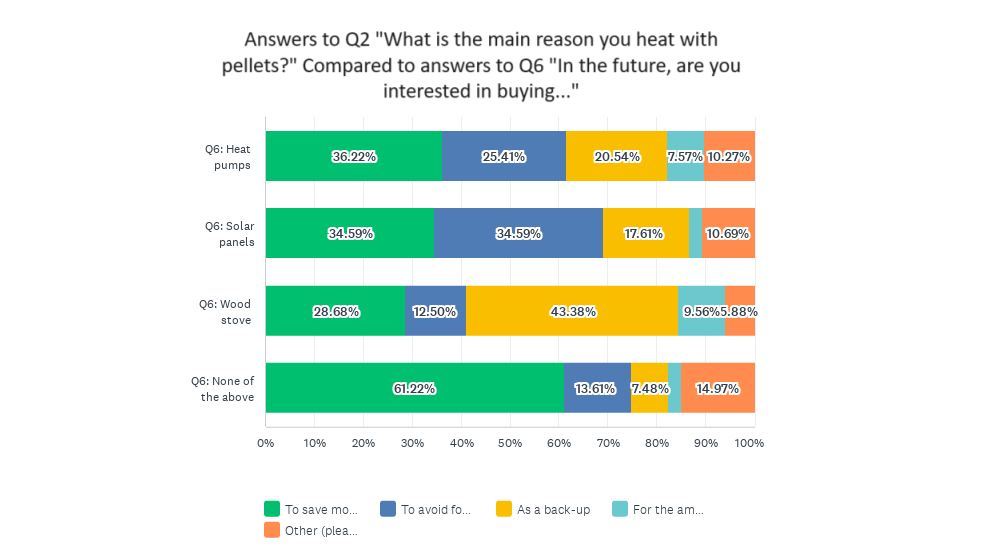
Comparing Q2 and Q6 unsurprisingly shows that people who heat with pellets who are more motivated to reduce fossil are the most likely to be interested in buying solar panels. And people who are more motivated to save money least interested in solar or heat pumps.
Reliability vs. interest in buying another pellet stove
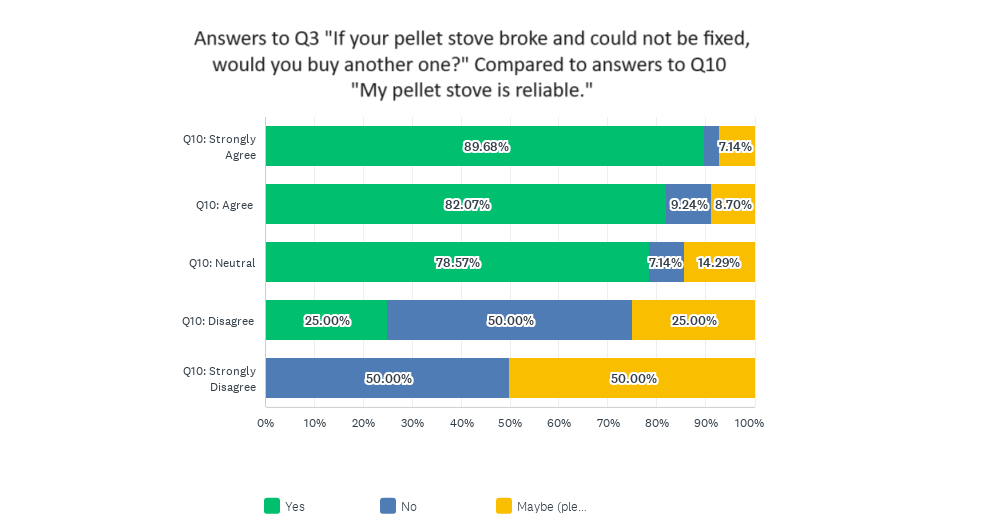
Unsurprisingly, overall those who agreed or strongly agreed that their pellet stove was reliable were most likely to want to buy another one if it broke down. Those who strongly agreed that their pellet stove was reliable were more than twice as likely to want to buy another.
Reliability and length of ownership
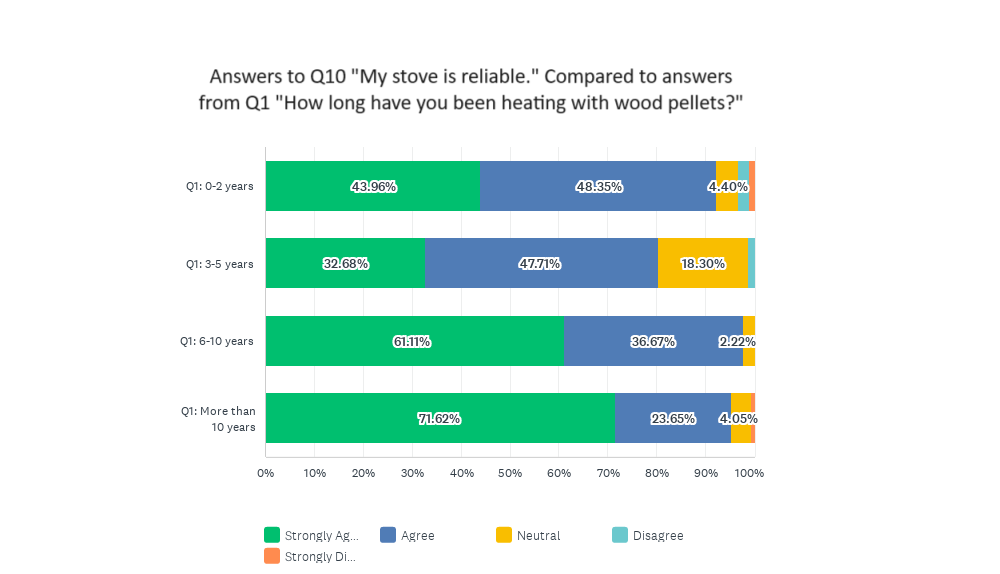
In this comparison, those who had their stove for longer than 10 years reported higher levels of satisfaction with reliability. And it was the group who owned stoves for 3 - 5 years who reported lower levels of satisfaction with reliability, possibly indicating that this is the period that repairs may be the highest.
Smelling smoke and length of ownership
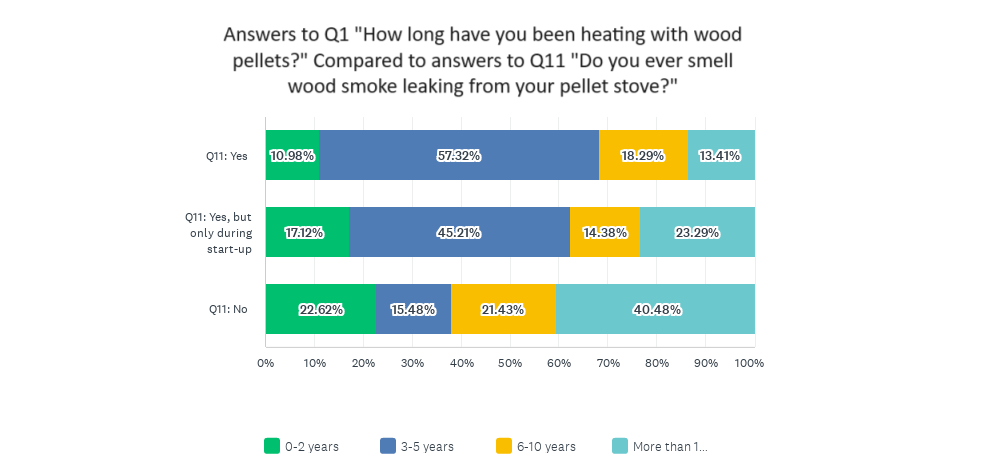
This indicates that the group who smells smoke the most is 3 - 5 year ownership and that the longer you own a stove the less smoke you report smelling.
Overlap between smelling wood smoke and being concerned about it
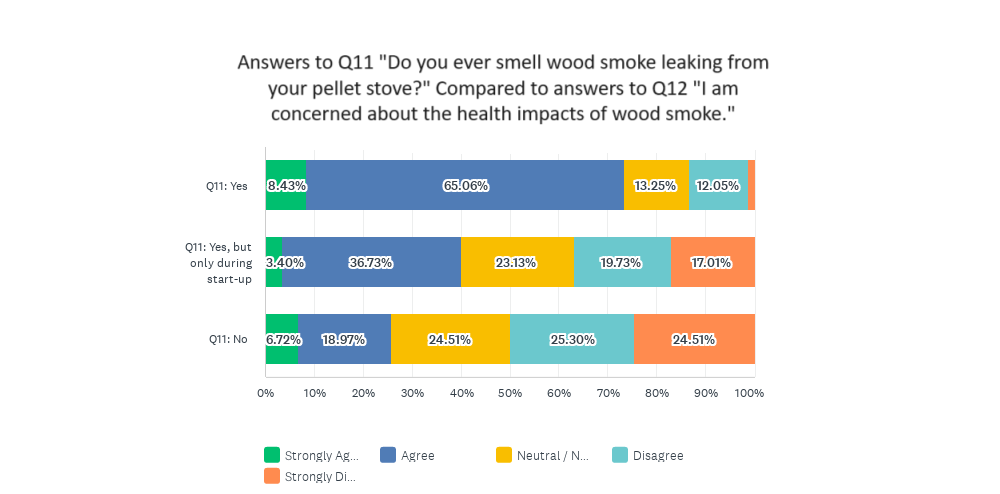
When comparing the answers of concern to those having reported that they were smelling smoke, a majority of those smelling smoke were also concerned about the impacts of wood smoke. Those who did not smell wood smoke from their stove were least likely to consider it a health issue. (Again, the ambiguous wording of Q12 makes this comparison less useful.)
Issues and Limitations of the Survey Data
AGH intentionally created a short and simple survey to increase respondent activity but this also naturally made it more susceptible to bot activity. In addition, we offered two $75 gift cards which likely increased bot activity even more. Survey Monkey also did not have an option to include a CAPTCHA at the end of the survey, which would have been a simple tool that could have stopped some bot activity.
Where IP addresses were repeated, and where the states also differed, the data was excluded from the analysis. Out of the original 626 responses, 140 of these were excluded on that basis. Bot activity appeared to be especially prevalent from batches of respondents identifying as being from Guam that also consistently submitted the same answer, with only one variation, for each submission. The exclusion of these responses did not significantly alter the results of any of the answers.